The modern marketer can access hundreds of data points across digital advertising, owned properties, customer research and other tactics. All that information can be overwhelming. So much so that a 2021 study by PHD and WARC found more than 88% of marketers globally say they spend most of their time on marketing reporting tasks. Reporting is often key to executive buy-in, support and increased budgets. At the same time, marketing reports are vital for the do-ers on the team, helping direct optimization and tactic selection. But it doesn’t need to make your head spin and eat up your time.
Truly impactful marketing reports have three things in common: good data, clear formatting and quality analysis. You can only get to quality analysis by investing time in figuring out the first two. Below, we will walk through the tools and questions you need to figure out which data to include and how to create a report that makes sense to all your stakeholders.
Common marketing report challenges
We often hear how difficult it is to know what data to focus on or how to truly measure success. Google Analytics alone has more than 20 different groupings of data available for review. Add on the dozens of other digital marketing and offline platforms available and it quickly becomes difficult to process. This can lead to decision paralysis or inefficient strategies decided by marketers’ guts, not supporting data.
How to find a marketing report format that works for you
At Lessing-Flynn (LF), we believe that the power of data is truly rooted in showcasing how all marketing tactics move the needle and impact business goals. It’s what your leadership team cares most about. You don’t need to inundate everyone with granular-level reporting. That’s a surefire way to get glazed eyes and have your report tabled to review later (if ever). That doesn’t mean that granular-level reporting isn’t important for your team that is executing those tactics every day. The trick is understanding who needs visibility to what data and giving it to them in a format they know how to read.
We often see two kinds of reports: an executive-level marketing report that focuses on how marketing is driving business results and a tactic-level marketing report that is used by the day-to-day team supporting that tactic.
To determine what to put in the executive-level marketing reports, ask yourself the following questions:
1. What are my organization’s business goals?
Example: Increase market share for XX product to 15% by the end of this fiscal year.
2. What are the key performance indicators (KPIs) that support those business goals that marketing can influence?
Example: Generate 200 marketing qualified leads for XX product by the end of this fiscal year.
3. Are there any key results at a tactic level that would demonstrate progress toward business goals and/or KPIs?
Example: Achieve a conversion rate of 5% of the Facebook lead generation campaign.
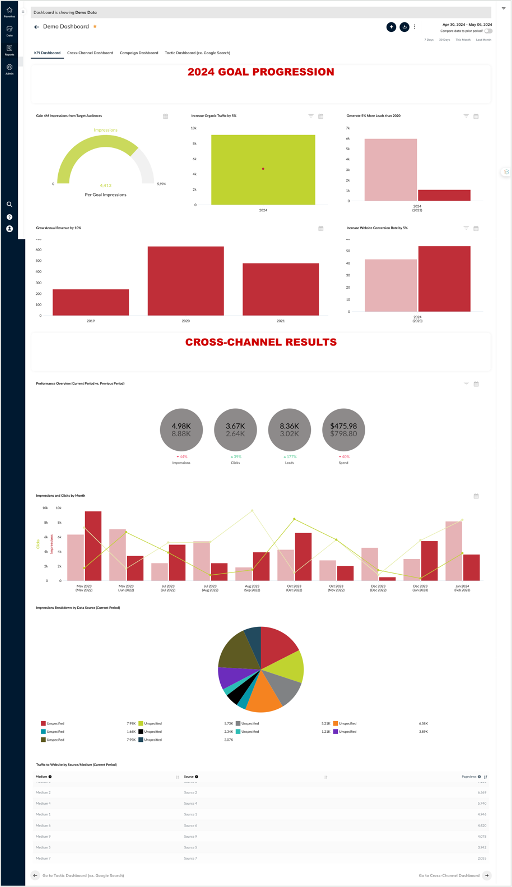
The resulting report should be high-level and look at data across all tactics in a cross-channel dashboard, normalizing results to help you and your executives understand impressions, clicks, leads and other conversions across all tactics. This focuses in on key metrics and can be extremely useful to identify optimizations or pivots that could be made across campaigns or strategies to further drive results while maximizing budget and team resources.
What does that mean for the tactic-level report? Consider who needs visibility to that level of data. Try to minimize the man-hours used to gather information with more limited use. Ask yourself:
- Can you leverage the reports built into the various platforms or do you need to export it to make sense of it?
- Can you to tap into a third-party tool like TapClicks or PowerBI to help you collect and analyze results?
At LF, we partner with TapClicks to automatically pull in data from dozens of sources and normalize it to help us quickly monitor campaign success.

How to write a marketing report
A page full of data and charts is great, but it is important to help provide analysis and context to those who read it. This could happen with annotations throughout the report or an executive summary identifying the top takeaways and resulting action items. Avoid regurgitating data that is included below in the report and keep your analysis easy to read by bolding key points, using bullets and line breaks, and keeping sentences and paragraphs short. Set a goal for someone to be able to read just your analysis and the first 2-3 charts on the dashboard to get everything they need to know in 5 minutes.
Marketing report example
LF leverages cross-channel dashboards to provide the appropriate level of depth and ease of use for marketing reports so that all reports are actionable and relevant.
Data doesn’t have to be overwhelming. By systematically approaching it with a focus on how you can measure success for your business, you can enhance your marketing data efficiency. Tying that with clear, concise analysis is the recipe for powerful marketing.
You don’t have to go through data analysis alone. The team at LF can help you hone your strategy and streamline creating marketing reports. We offer personalized trainings to help you tackle your most frustrating marketing challenges. Contact us here.
LF Newsletter Alert
Want Lessing-Flynn to rock the socks off your inbox with insights and more?


